
This handout contains a number of suggested thought-activities, aimed at understanding and appreciating the use of graphs for representing relationships and problems from a variety of domains. The particular examples range from those that can immediately be seen as a graph, to those which would be quite difficult without any hints. It will help your students if you first do several examples, and in particular, go through an example of some of the less natural types of problems. (In particular, the graph representation for searching through the "state space" of a problem to find a solution (examples 11, 12, and 13), will need to be motivated.
The following questions will be useful to keep in mind when considering each example below:
Example 1
Consider the floorplan of your house. How can you represent this as a graph? What does a cycle mean? What would it mean if the graph representing your house were disconnected? Is it a directed or undirected graph? Is it a planar graph?
Example 2
In a round-robin tournament (each team plays every other team once), the Tiggers beat the Heffalumps, the Poohs, and the Pligets. The Heffalumps beat the Pligets and the Poohs, and the Pligets were beaten by the Poohs. Show this as a graph and discuss it.
Example 3
Draw a graph representing the relationship of is-divisible-by between the numbers 2,3,4,..., 12. What special properties do you notice? Are there any special vertices? Which?
Example 4
The towns of Alma, Curtis, Grant, Jackson, Potter, and Shelby would each like to have a new television station for broadcasting their local news. All of the channels between 2 and 13 have been taken, so they apply to the FCC for a new channel (frequency) to operate on. To avoid interference, the FCC does not allow two stations to operate on the same channel unless they are 150 miles or more apart. One solution would be to simply give each of the towns a different channel (channels 14, 15, 16, 17, 18, and 19). But perhaps this can be done by assigning fewer different channels, since cities far enough apart can use the same station. Below is a table showing the distance between each pair of cities. Model the problem as a graph, and use the graph to find a good way to assign as few channels as you can.
|
Distance |
ALMA |
CURTIS |
GRANT |
JACKSON |
POTTER |
SHELBY |
|
ALMA |
|
|
|
|
|
|
|
CURTIS |
|
|
|
|
|
|
|
GRANT |
|
|
|
|
|
|
|
JACKSON |
|
|
|
|
|
|
|
POTTER |
|
|
|
|
|
|
|
SHELBY |
|
|
|
|
|
|
Example 5
Bob is older than Frank, but younger than Charles. Charles was born 5 days before Evan, who has a younger sister named Donna. Donna is younger than Bob, and Gail is younger than Frank. Alice, by the way, is older than Bob.
For each of the following pairs of people, decide who is the older, or explain why it cannot be determined.
A properly drawn graph should make the answers easy to see. In the graph, how can you tell if one person is older than the other? How can you tell if it cannot be determined?
Example 6 (a "precedence" graph).
A precedence graph is a directed graph showing which tasks must occur before other tasks. Draw a precedence graph that shows the precedence relationship between the following tasks that Joey must complete before going to bed. Note that in a precedence graph, edges are only drawn to show tasks that MUST occur before other tasks, not tasks which MAY occur before other tasks.
Tasks include: Climbing into bed, brushing teeth, putting on PJs, taking a bath, eating a snack, and turning the night light on at the far corner of his room.
Reading from the graph, can you determine a possible order for Joey to accomplish his goal of getting to bed? Hurry up, he's getting cranky. How many different ways can he order the tasks and get to bed, without violating any of the precedence constraints?
Example 6.1, 6.2, etc. (more precedence graphs)
Draw a precedence graph showing how one might get dressed every morning. Include as many articles of clothing as you can. How can a precedence graph be used to help a general contractor build a house? Draw one, perhaps researching house-building methods first. What are other examples where precedence graphs are useful?.
Example 7
Consider the problem of finding your way through a maze. How would you represent a maze as a graph? What would a solution correspond to in the graph? Draw a simple maze, the corresponding graph, and the solution in both.
Example 8
Consider the world-wide-web (WWW). In what ways can it be represented as a graph? Is it a directed or undirected graph? What do you think the diameter is? (The distance (number of edges) between vertices that are farthest apart.)
Example 9
In a particular country, there are 10 different satellites which are used for telephone communications. Each customer is assigned exactly one satellite (the closest one). If Alice and Bob are assigned the same satellite, then a phone call between them is just routed from Alice, to the satellite, then to Bob, and vice versa. But if they are assigned diffferent satellites, (say SAT-A and SAT-B), then the call from Alice to Bob goes from Alice, to SAT-A, then through some number (preferably as few as possible) other satellites, to SAT-B, and then finally to Bob. Not all satellites can communicate with eachother however. The following data describes which satellites can communicate with eachother:
SAT-A and SAT-B can communicate. SAT-A and SAT-C can communicate. SAT-B and SAT-D can communicate. SAT-C and SAT-D can communicate. SAT-D and SAT-E can communicate, as can SAT-D and SAT-F. SAT-E and SAT-F can communicate. SAT-E and SAT-G can communicate. SAT-F and SAT-G can communicate. SAT-F and SAT-H can communicate. SAT-H and SAT-I can communicate.
Represent this as a graph, and answer the following questions:
Example 10
Professor Appel's school of coloring needs to schedule final examinations. Since the teachers and students have big plans for the summer, they would like all examinations to be finished as soon as possible. Mr. Appel is trying to schedule exams for different classes at the same time, but realizes that if some student is taking two different classes, then those classes must have exams at different times - otherwise the student would have to be in two places at one time. Can you represent this as a graph problem? (Hint: let the vertices be the names of the classes, and draw an edge between a pair of vertices if there is at least one student that is taking both classes. ) Professor Appel, being fond of coloring, has decided to code the exam times by colors. (Red = Monday morning, Blue = Monday afternoon, Green = Tuesday morning, etc.) He colors two vertices the same color to indicate that their exams will be scheduled at the same time. If he colors his graph in this way, what will a good exam schedule look like? (What property will it have?) If he accidentally schedules two exams at the same time that should not be scheduled simultaneously, what will that look like on his graph? Construct a few specific examples (for you, or for your class) to illustrate these points.
Example 11 (Introduction to "state space search graphs").
A farmer wishes to cross a river with his fox, chicken, and bag of seed. His boat however, will hold only him, and at most one of the other items. If he leaves the fox alone with the chicken, the fox will eat the chicken, and if he leaves the chicken alone with the seed, the chicken will eat the seed. How can he safely transport the fox, chicken and seed across the river? (He must be in the boat for it to cross. The river is deep and the man cannot swim (or hang onto the outside of the boat, etc., while crossing.)
This problem appears to have nothing to do with graphs, yet provides a good example of how rephrasing a problem as a searching problem on an appropriately chosen graph can simplify the search for a solution. The general technique is to think of the different possible "states" of the world that are relevant to the problem. (By "state" we don't mean Illinois, etc., but rather, a description of a possible configuration of the world, with just the detail that is relevant to the problem.) For example, the initial state of the world, is the man, fox, chicken, and seed, on side A of the river. Another state, the goal state, is with the man, fox, chicken, and seed on side B of the river. Another possible (undesirable) state is with the man and fox on side A, and the chicken and seed on side B. After determining the states, we ask what the operations (or "transitions") are available that change the world from one state to another. In this example, it is the man crossing the river alone, or with one item. If a transition allows one state to turn into another, then we draw an edge between the two states. (If you did <A HREF="../05-fsm">Lesson 5</A> on Finite State Machines, then you will note that we are talking about almost the same type of thing here - with good reason - a finite state machine is a graph representing the state of some system!) Finally, the search for a solution is simply that of determining whether there is a path in this "state-space graph" that connects the initial state to the goal state. Often, rather than list all of the states first, we build the graph as we go, discovering states by applying transitions. Below, we've started the state-space graph for this problem. Continue the construction until you have found the solution.
Notation: The man (m) starts with the fox (f), chicken (c) and seed (s) on Side A of the river. We assume that the boat is always with the man. The initial state of the world looks like this:
There are four possible things the man might do first: cross alone, cross with the fox, cross with the chicken, or cross with the seed. We'll draw the only one of these that wouldn't cause problems man with chicken), and then draw an edge between the initial state and the new state, labeling the edge with which operation produced the new state. (We'll label the edge with the names of the items that crossed - in this case, man (m) and chicken (c). Our graph now looks like this:
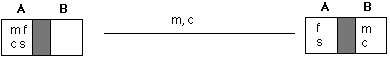
Continue constructing the graph. Hopefully, somewhere in it will be a vertex that looks like this (the goal state).

Example 12
This is another state-space graph search problem. Suppose you have two jugs, one capable of holding 5 cups, and one capable of holding 8 cups. However, the jugs are irregularly shaped and without markings, so you can't determine how much water is in either jug unless it is completely full or completely empty. You also have a faucet, and as much water as you'd like. Can you get 3 cups? (Easy, fill the 8, pour into the 5, and what is left in the 8 is equal to 3 cups. More interesting: can you obtain 1 cup? 2 cups? 4 cups? 6 cups? 7 cups? Model this as a graph problem, and solve. See Example 11 above to understand state-space search graphs.
Example 13
This is yet another state-space search graph. Consider a chessboard that is only 3 columns wide by four rows high. Recall that a knight moves in the game of chess by moving either two squares horizontally followed by one vertically, or else two squares vertically followed by one horizontally. (That is, the knight makes something like an "L" shape.) Can a knight start at any location on the 3 by 4 board, and visit every square? Can it do it without re-visiting any square? Use a state-space search graph to represent this problem, and to find a solution. Variation: how about on a 3 by 3 chessboard?